NVivo is your go-to software for tackling qualitative data analysis like a pro. This guide dives deep into its core functionalities, from importing your data to generating killer visualizations and reports. We’ll cover everything from basic coding to advanced querying techniques, showing you how to wrangle even the most massive datasets. Get ready to unlock the secrets of your research!
We’ll walk you through the entire process, from setting up your project and importing data (think interviews, surveys, and more!), to coding and categorizing your findings. We’ll explore different query types, show you how to create stunning visuals to present your research, and even cover troubleshooting tips to keep you on track. By the end, you’ll be an NVivo ninja!
NVivo’s Core Functionality
NVivo is a qualitative data analysis software that helps researchers organize, analyze, and interpret large amounts of textual and multimedia data. It’s basically a super-powered organizational tool and analytical engine designed to make sense of complex information, streamlining the often-daunting process of qualitative research. Think of it as your digital research assistant, helping you manage your data and uncover meaningful patterns.NVivo’s core functionality revolves around several key processes: data import, coding and categorization, querying and visualization, and report generation.
These processes work together to allow researchers to explore their data in a flexible and systematic way, leading to richer insights and stronger conclusions.
Data Types Handled by NVivo
NVivo is remarkably versatile in the types of data it can handle. It goes far beyond just text documents. Researchers can import and analyze a wide variety of data sources, making it a powerful tool for mixed-methods research. This flexibility is a major strength, allowing researchers to integrate different perspectives and data points for a more holistic understanding.
- Text Documents: Word documents, PDFs, transcripts, and other text files are easily imported and analyzed.
- Audio and Video Files: NVivo can handle audio and video files, allowing for the transcription and analysis of interviews and focus groups. The software allows researchers to link coded segments to specific points within the audio or video files, creating a rich, interconnected data set.
- Images: Images can be imported and analyzed, allowing for visual data to be integrated into the research process.
- Spreadsheets: Numerical data from spreadsheets can be imported and linked to other qualitative data, providing a mixed-methods approach.
- Web Pages: NVivo can import and analyze content from web pages, allowing researchers to analyze online data sources.
Importing Data into NVivo: A Step-by-Step Guide
Getting your data into NVivo is the first step in the analysis process. This is generally straightforward, but understanding the options available will help you organize your project effectively from the start. The process is similar regardless of the data type, though the specifics of how the data is displayed and handled will vary.
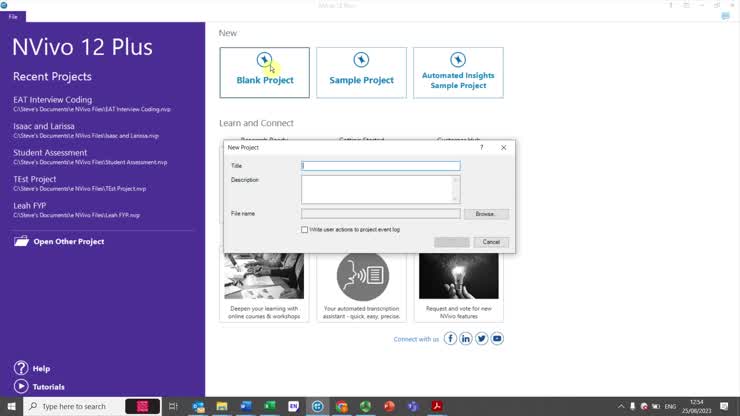
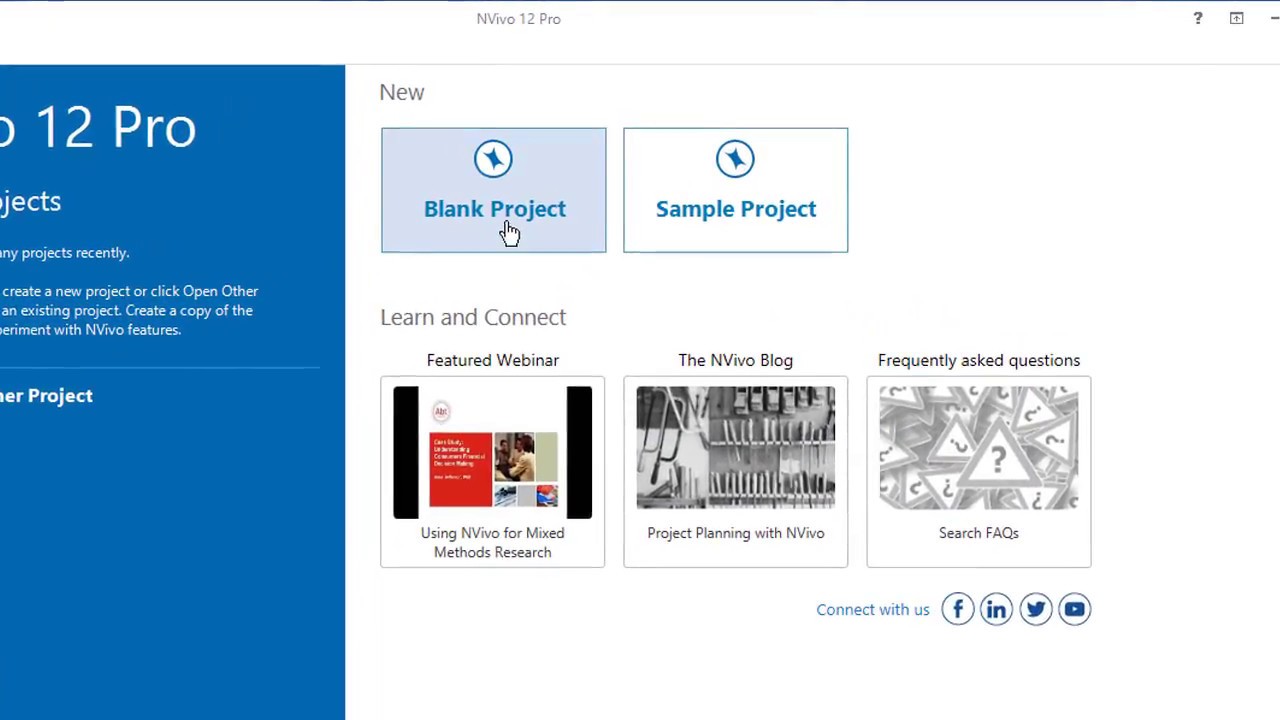
- Create a New Project: Upon opening NVivo, you’ll be prompted to create a new project. Give your project a descriptive name and choose a location to save it.
- Import Data: Use the “Import” function (usually found in a file menu) to select the type of data you want to import. Navigate to the location of your files and select the ones you wish to analyze. NVivo supports batch importing, making it easy to add multiple files at once.
- Organize Your Data (Optional): Once imported, consider organizing your data into folders within the NVivo project. This helps maintain a structured and manageable project, especially when dealing with a large volume of data. Think of this as creating a digital filing cabinet for your research materials.
- Review the Imported Data: Always take a moment to review the imported data to ensure it has been imported correctly and is displayed as expected. This helps prevent issues later in the analysis process.
Coding and Categorization in NVivo
Okay, so you’ve got your data in NVivo, now what? Time to start making sense of it all through coding and categorization. Think of it like organizing a massive, overflowing closet – you need a system to find what you need quickly and efficiently. NVivo provides the tools, but you’ll need a strategy.
Creating codes and categories in NVivo is pretty intuitive. You essentially assign labels (codes) to sections of your data that represent key themes, concepts, or ideas. These codes can then be grouped together into broader categories, allowing you to analyze relationships and patterns. You can create codes directly from the text, using the in-vivo coding feature, or you can create them beforehand based on your research questions and hypotheses.
Once you have your codes and categories set up, you can start querying your data to identify relationships between them, allowing you to start building compelling arguments in your research.
Code and Category Creation
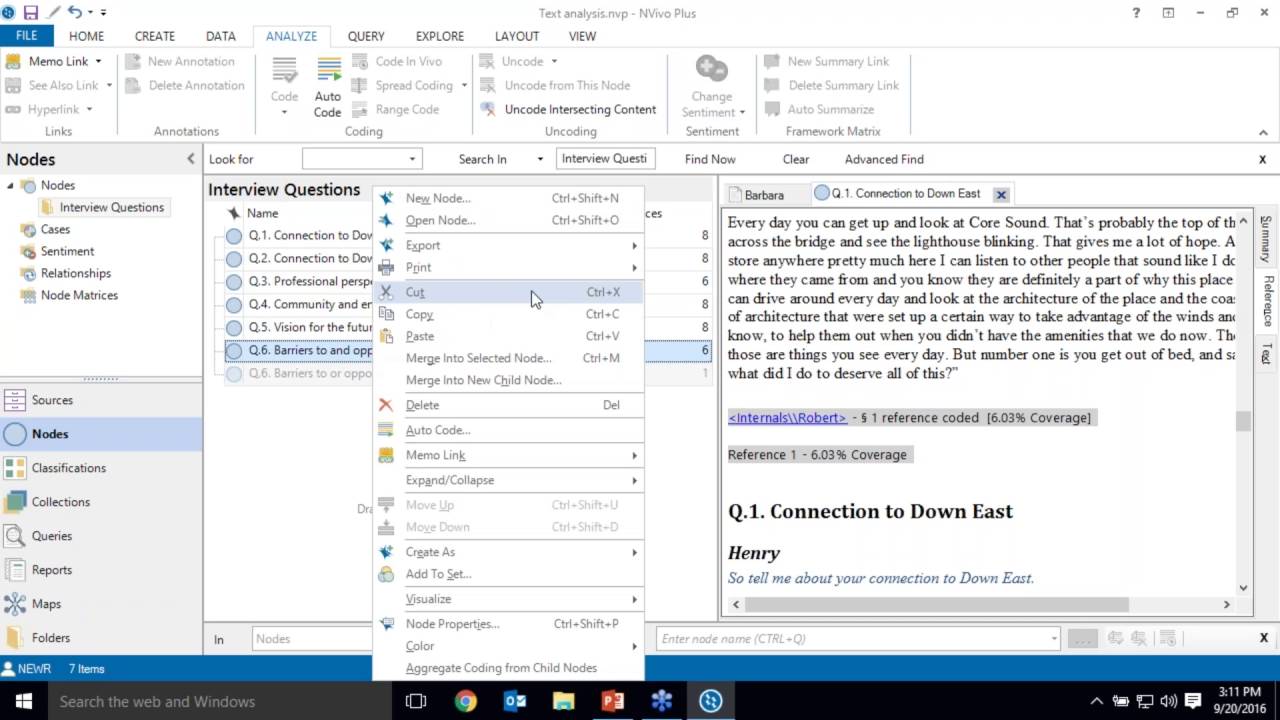
Creating codes is simple. You highlight a section of text, then right-click and select “Create Code.” You’ll name your code (be descriptive!), and NVivo will automatically link that code to the highlighted text. Categories are created similarly, but they act as containers for codes. This hierarchical structure allows for a nuanced and organized approach to your data analysis.
For example, you might have codes like “Positive Customer Feedback,” “Negative Customer Feedback,” and “Neutral Customer Feedback,” all nested within a broader category called “Customer Sentiment.” This system allows for a layered analysis that goes beyond simple frequency counts.
Best Practices for Developing a Robust Coding Framework
Developing a solid coding framework is crucial for a successful NVivo project. Think about it like building a house: a weak foundation will lead to problems down the line. Here are some tips:
First, clearly define your research questions and objectives. Your coding framework should directly address these questions. Next, develop a preliminary codebook before you start coding. This ensures consistency and avoids arbitrary code creation during the process. Then, regularly review and refine your coding framework as your analysis progresses.
Your initial framework might need adjustments as new themes emerge from your data. Finally, maintain a clear and concise codebook, documenting each code and its definition. This will ensure consistency and help others understand your coding scheme.
Different Coding Strategies in NVivo
NVivo supports various coding strategies, each with its strengths and weaknesses. The choice depends on your research design and goals.
For instance, you could use deductive coding, where you apply pre-defined codes based on your existing theoretical framework. Alternatively, you could use inductive coding, where you develop codes directly from the data, allowing for emergent themes to be identified. A mixed-methods approach combining both is also possible and often preferred. A further strategy is axial coding, which involves linking codes to sub-categories and main categories, creating a more complex relationship between your codes.
Choosing the right approach is key to maximizing the insights gained from your data.
Querying and Analyzing Data in NVivo
Okay, so you’ve coded and categorized your data in NVivo – congrats! Now the fun really begins: uncovering those hidden insights. NVivo’s querying tools are your secret weapon for making sense of all that hard work. Think of it like having a super-powered magnifying glass for your research data.
NVivo offers a range of querying techniques to help you analyze your data in various ways, allowing you to explore relationships, patterns, and themes within your dataset. These queries go beyond simple word counts, offering sophisticated tools for in-depth analysis.
Word Frequency Queries
Word frequency queries are a great starting point for any NVivo analysis. They simply show you how often specific words or phrases appear in your data. This can quickly highlight key themes or concepts prevalent in your interviews, documents, or other sources. For example, if you’re analyzing customer feedback, a high frequency of words like “frustrated” or “unhappy” might signal a problem area needing attention.
The results are often presented in a table showing the word, its frequency, and sometimes its relative frequency (percentage of total words). You can then export this data for further analysis or presentation in reports.
Matrix Queries
Matrix queries are where things get really interesting. They let you explore relationships between different sets of nodes (your codes and categories). Imagine you’re studying public opinion on a political issue. You could create a matrix query showing the relationship between different demographic groups (coded as nodes) and their opinions (also coded as nodes). The resulting matrix displays the frequency of each opinion within each demographic group, revealing potential correlations or disparities.
This visual representation makes it much easier to spot trends that might be missed with simple word frequency counts. For instance, you might discover that a particular opinion is significantly more prevalent among a specific age group.
Workflow for Analyzing Data Using NVivo Queries
A typical workflow for using NVivo queries might look like this:
- Define your research questions: Before diving into queries, clearly articulate the questions you want your data to answer. This will guide your query design and interpretation.
- Code and categorize your data: Ensure your data is thoroughly coded and categorized using a well-defined coding scheme. This is the foundation for meaningful query results.
- Develop your queries: Based on your research questions, select appropriate query types (word frequency, matrix, etc.). Experiment with different query parameters to explore various aspects of your data.
- Interpret the results: Carefully examine the query output. Look for patterns, trends, and anomalies that address your research questions. Don’t just look at the numbers; consider the context of your data.
- Refine your analysis: Based on your initial findings, refine your queries or develop new ones to explore specific aspects of your data in greater detail. This iterative process is key to unlocking deeper insights.
Visualizing Data in NVivo
Okay, so we’ve coded, categorized, and queried our data in NVivo. Now it’s time to make sense of it all visually! NVivo offers powerful visualization tools to help you see patterns and relationships you might miss just looking at text. Think of it as taking your data from a jumbled pile of notes to a clear, insightful infographic.Visualizing data in NVivo is all about transforming your qualitative data into easily digestible charts and diagrams.
This helps you communicate your findings more effectively, identify key themes, and ultimately, support your research arguments. These visualizations aren’t just pretty pictures; they are critical tools for making complex data more understandable.
Visual Representations of Code and Category Relationships
NVivo allows you to create visual representations of the connections between your codes and categories. This helps you grasp the hierarchical structure of your data and identify overlaps or gaps in your coding scheme. Imagine you’re researching social media’s impact on teenagers’ self-esteem. You might have codes like “positive self-perception,” “negative self-perception,” and “social comparison,” all falling under the broader category “Self-Esteem.” A visual representation would instantly show how these codes relate to the overarching theme.
| Category | Code 1 | Code 2 | Code 3 |
|---|---|---|---|
| Self-Esteem | Positive Self-Perception | Negative Self-Perception | Social Comparison |
| Academic Performance | High Grades | Low Grades | Study Habits |
| Social Life | Close Friends | Social Isolation | Online Interactions |
This table is a simplified example; NVivo’s visualizations can be much more complex and interactive, allowing you to explore relationships in more detail. For instance, you could see the frequency of each code within a category, or even map connections between different categories.
Organizing Data Visualizations for Effective Communication
Once you’ve created your visualizations, it’s crucial to present them in a clear and concise manner. Think about your audience – what kind of visual representation will best communicate your findings to them? A simple bar chart might be perfect for showing the frequency of different codes, while a network diagram could be better for illustrating complex relationships between categories.
Avoid overwhelming your audience with too much information at once; focus on highlighting the most important findings. Consider using clear labels, legends, and a consistent color scheme to maintain visual clarity.
How Visual Representations Enhance Understanding of Complex Datasets
Visualizations significantly improve the understanding of complex datasets by providing a concise overview of your data. They allow you to quickly identify patterns, trends, and outliers that might be difficult to spot in raw text data. For example, a word cloud can instantly reveal the most frequent words in your data, while a network diagram can illustrate the connections between different concepts.
This makes identifying key themes and supporting your arguments much easier. By transforming abstract concepts into visual representations, you can create a more compelling and persuasive narrative for your research. This is especially helpful when presenting your findings to others, whether it’s in a presentation, report, or academic paper.
Managing Large Datasets in NVivo
Working with massive datasets in NVivo can feel like navigating a sprawling digital library. The key is strategic planning and leveraging NVivo’s features to maintain organization and efficiency. Failing to do so can lead to analysis paralysis and inaccurate conclusions. This section will explore practical strategies for effectively managing large projects within NVivo.
Efficiently managing large datasets in NVivo requires a proactive approach from the project’s outset. Poor initial planning often results in a chaotic and unwieldy project that becomes increasingly difficult to manage as the data grows. A well-defined coding framework and consistent data organization are crucial for navigating large volumes of information. The strategies discussed below aim to mitigate common challenges and streamline the research process.
Data Import and Pre-Processing Strategies
Effective management begins before data even enters NVivo. Consider pre-cleaning your data in other software (like Excel or a text editor) to remove irrelevant information or inconsistencies. This reduces NVivo’s processing load and improves the overall efficiency of your analysis. For example, standardizing date formats or removing duplicate entries before import can save significant time and effort. Import data in smaller, manageable chunks if your computer’s resources are limited; this reduces the strain on NVivo and prevents crashes.
This phased approach also allows for easier error detection and correction during the import process.
Strategies for Efficient Coding and Categorization
With large datasets, a well-defined coding framework is paramount. Employ a hierarchical coding structure with broad categories branching into increasingly specific subcategories. This allows for flexible yet organized data management. Using consistent coding practices among team members, if applicable, ensures uniformity and facilitates collaboration. Regularly review and refine your coding scheme as your understanding of the data evolves.
This iterative approach helps to maintain relevance and accuracy throughout the analysis.
Utilizing NVivo’s Search and Filtering Capabilities
NVivo’s powerful search functions are invaluable for navigating extensive datasets. Utilize Boolean operators (AND, OR, NOT) to refine searches and isolate specific data segments. Employ wildcard characters (*) to capture variations in spelling or phrasing. Regularly utilize NVivo’s filtering options to narrow down your focus to specific nodes, cases, or documents, enabling more targeted analysis. For instance, focusing your search on specific coded segments significantly reduces the volume of data you need to actively review.
Managing Project Size and Performance
Large NVivo projects can consume considerable system resources. Regularly save your project to prevent data loss and maintain a backup copy. Consider using NVivo’s “compress project” function to reduce file size and improve performance. If your project becomes excessively large and unwieldy, consider splitting it into smaller, more manageable sub-projects based on themes or research questions. This approach simplifies navigation and improves overall responsiveness.
Collaboration and Version Control
When working collaboratively on a large NVivo project, establish clear guidelines for coding and data management. Utilize NVivo’s collaboration features to facilitate shared access and ensure consistent data handling. Implement a version control system (external to NVivo) to track changes and revert to previous versions if necessary. This ensures that everyone is working with the most up-to-date version of the data and minimizes potential conflicts.
Regularly scheduled team meetings to discuss progress, address challenges, and ensure consistent methodology can help prevent errors and streamline workflow.
Collaboration Features in NVivo
NVivo’s collaborative features are a game-changer for qualitative research teams, allowing for shared access, simultaneous work, and streamlined project management. These features significantly reduce the time spent on data transfer and reconciliation, leading to more efficient and collaborative analysis.Working on large qualitative datasets often involves multiple researchers with different perspectives and expertise. NVivo facilitates this by offering several tools to manage this complexity, promoting transparency and reducing potential inconsistencies in the analysis process.
These features enhance the overall quality of the research by leveraging the strengths of a team while mitigating the risks associated with independent analysis.
Shared Projects and Access Control
NVivo allows multiple users to access and work on the same project simultaneously. This eliminates the need for constant data transfers and ensures everyone is working with the most up-to-date version of the project. The software provides granular control over user permissions, allowing project managers to assign different roles and access levels to team members. For instance, one researcher might have full editing rights, while another might only have read-only access.
This ensures data integrity and prevents accidental modification of critical project components.
Version Control and History Tracking
A key aspect of collaboration is maintaining a clear record of changes made to the project. NVivo’s version control features track all modifications, allowing researchers to revert to previous versions if necessary. This is particularly useful when multiple team members are working on the same nodes or documents. The history tracking functionality provides a transparent audit trail, facilitating accountability and enabling easy identification of any discrepancies or errors.
Imagine a team member accidentally deleting a crucial node; version control allows for quick recovery without impacting the entire project.
In-Software Communication Tools
NVivo integrates communication tools that streamline collaboration. Researchers can directly comment on nodes, documents, or queries within the software itself. These comments are directly associated with the specific part of the data being discussed, providing a context-rich environment for discussion and feedback. This feature significantly reduces the reliance on external communication channels, such as email, keeping all project-related discussions centralized within NVivo.
This enhances clarity and avoids potential misunderstandings arising from fragmented communication.
Comparison with Other Software
While other qualitative data analysis software packages offer some collaborative features, NVivo’s integrated approach stands out. Some competitors might rely on external tools or cloud storage for collaboration, which can lead to integration issues and potential data security concerns. NVivo’s built-in collaborative features create a more seamless and secure workflow. For example, unlike some software that only allows for file sharing, NVivo allows for simultaneous access and editing of the project itself, greatly enhancing efficiency.
The level of control over user permissions and the integrated communication tools further differentiate NVivo in the context of collaborative research.
NVivo and Different Research Methodologies

NVivo’s flexibility makes it a powerful tool for a wide range of qualitative research approaches. Its ability to manage large datasets, code text and images, and generate visualizations makes it adaptable to various methodologies, enhancing the rigor and efficiency of the analysis process. This section will explore how NVivo supports specific qualitative research methodologies.
NVivo’s Application in Grounded Theory
Grounded theory, focusing on developing theories inductively from data, benefits significantly from NVivo’s features. The iterative nature of grounded theory, where theory emerges from the data, is well-supported by NVivo’s coding and memoing capabilities. Researchers can code data repeatedly, refining codes and categories as they identify patterns and relationships. The software facilitates the constant comparison of data segments, a crucial step in grounded theory, by allowing for easy retrieval and comparison of coded data based on various criteria.
For example, a researcher studying organizational change might initially code data for broad themes like “resistance to change” and “employee morale.” As the analysis progresses, they might refine these codes into subcategories like “fear of job loss” and “lack of communication,” allowing for a more nuanced understanding of the phenomenon. NVivo’s visualization tools then help to map the relationships between these codes and subcategories, revealing emergent theoretical frameworks.
NVivo’s Support for Thematic Analysis
Thematic analysis, aiming to identify, analyze, and report patterns (themes) within data, is streamlined by NVivo. The software aids in identifying recurring themes by facilitating the organization of coded data into meaningful categories. Researchers can use NVivo’s search functions to locate specific words, phrases, or concepts across the entire dataset, helping identify potential themes. The ability to create and manage multiple codes and categories enables researchers to explore the data from different perspectives and refine themes as they emerge.
For instance, a researcher exploring social media posts related to a particular political campaign could use NVivo to identify themes related to candidate support, policy positions, and campaign strategies. The software would allow them to easily track the frequency and context of these themes, leading to a robust thematic analysis. NVivo’s matrix queries can then reveal interesting relationships between different themes.
NVivo’s Features Supporting Different Qualitative Data Analysis Approaches
NVivo offers several features that are broadly applicable across various qualitative methodologies. Its flexible coding system allows for both pre-defined and emergent coding, catering to deductive and inductive approaches. The ability to create memos allows researchers to document their analytical decisions and interpretations, enhancing transparency and traceability. The software’s querying and visualization tools enable researchers to explore relationships within the data, generating insights that might not be apparent through manual analysis.
For example, the creation of word clouds can visually represent the most frequently occurring words in the dataset, while network diagrams can illustrate the relationships between codes and categories, providing a holistic overview of the data. These features are invaluable regardless of the specific methodology employed, strengthening the analysis process.
Exporting and Reporting Results from NVivo
Getting your findings out of NVivo and into a presentable format is the final, crucial step of your research journey. NVivo offers a variety of export options to help you share your analysis effectively, whether you’re writing a dissertation, preparing a presentation, or creating a report for stakeholders. Understanding these options and best practices will ensure your hard work is communicated clearly and convincingly.Exporting data from NVivo involves choosing the right format for your needs.
You aren’t limited to just one method; NVivo provides flexibility depending on your chosen method of presentation.
Data Export Options
NVivo allows you to export various data types in multiple formats. You can export your entire project, specific nodes, or even just the coding of your data. This allows for granular control over what information is shared and how.
- Nodes and Codes: Export individual nodes or groups of nodes, including their contents and coding, as text files (.txt), spreadsheets (.csv, .xlsx), or even RTF files for richer formatting.
- Matrices: Export data from matrices (like word frequency counts or co-occurrence matrices) to spreadsheets for further analysis or visualization in other software.
- Queries: The results of your queries (e.g., word frequencies, network visualizations) can often be exported as tables or images.
- Reports: NVivo itself allows for the creation of reports that combine text, tables, and charts summarizing your findings. These reports can then be exported as PDFs or Word documents.
- Entire Project: For archiving or collaboration, you can export your entire NVivo project file (.nvp). This preserves all your data, coding, and analysis for future use.
Sample Report: Analyzing Social Media Sentiment Towards a New Product
Let’s say we used NVivo to analyze social media posts about a new phone, “PhoneX.” We coded posts for sentiment (positive, negative, neutral) and features mentioned (camera, battery, design).Here’s a snippet of a potential report:
Overall, sentiment towards PhoneX was largely positive (65% of posts).
So, NVivo’s awesome for qualitative data analysis, right? But I remember back in the day, trying to import some old project files that relied on things like adobe flash player for embedded media – total nightmare. Thankfully, most modern NVivo versions handle that better, focusing on more relevant file types now. It’s a huge improvement compared to those frustrating compatibility issues.
The camera received the most positive feedback, with 40% of positive mentions directly referencing its quality.
However, battery life emerged as a key area for improvement, with 30% of negative comments focusing on battery performance.
Best Practices for Presenting NVivo Results
Clearly presenting your findings is key to impactful communication. Consider these best practices:
- Context is Crucial: Always provide sufficient background information to your audience. Clearly explain your research question, methodology, and data sources.
- Visualizations are Key: Charts, graphs, and networks derived from NVivo’s querying tools make complex data easier to understand. Use them strategically to highlight key findings.
- Focus on Key Themes: Don’t overwhelm your audience with every detail. Focus on the most significant findings and insights revealed by your NVivo analysis.
- Support Claims with Evidence: Always back up your claims with data from your NVivo analysis. Use direct quotes from your source material (appropriately cited) to illustrate your points.
- Choose Appropriate Export Formats: Select export formats that are suitable for your audience and the intended purpose of your report (e.g., PDF for formal reports, spreadsheets for detailed data analysis).
Advanced Techniques in NVivo
Okay, so we’ve covered the basics of NVivo – coding, querying, visualizing your data. Now let’s dive into some seriously powerful stuff that’ll make your research way more efficient and insightful. These advanced techniques are less about “doing things” and more about “doing things
smartly*.” Think of them as power-ups for your qualitative analysis.
Advanced features in NVivo go beyond simple coding and querying. They allow for sophisticated data manipulation, complex relationship analysis, and the creation of models that represent your data in a more nuanced way. This level of analysis enables researchers to uncover deeper insights and patterns that might be missed with simpler methods.
Model Building in NVivo
NVivo allows you to build models that represent the relationships between your data. For example, imagine you’re studying the factors influencing customer satisfaction. You could create a model showing the relationships between product quality, customer service, and overall satisfaction. This visual representation makes it much easier to understand complex interactions and identify key drivers of customer satisfaction. Instead of just seeing isolated codes, you see how they connect and influence each other.
Building these models involves using NVivo’s features to create nodes and links representing concepts and their relationships. Then, you can use NVivo’s querying capabilities to explore and refine your model, testing different hypotheses about how these concepts interact. The efficiency gain comes from having a clear, visual representation of your data’s structure, making pattern recognition far easier than sifting through endless text.
Complex Query Functions
Simple queries in NVivo are like asking, “Show me all the nodes coded with ‘customer service.'” Complex queries are like asking, “Show me all the nodes coded with ‘customer service’
- and* ‘negative feedback,’
- but only if* they’re also linked to nodes coded with ‘product defect.'” This level of specificity allows you to uncover subtle relationships and patterns that would be impossible to find with basic searches. For instance, a researcher studying social media discourse could use complex queries to identify specific themes that co-occur with particular emotional expressions. This offers a much more detailed understanding than simply identifying the presence of those themes in isolation.
The efficiency boost here is significant; you’re pinpointing exactly the data you need, eliminating the time spent wading through irrelevant information.
Comparing Advanced and Simple Methods
Let’s say you’re analyzing interview transcripts about a new software program. A simple approach might involve coding each transcript for positive and negative feedback. This gives you basic sentiment analysis. However, using advanced techniques, you could build a model showing how specific features of the software (e.g., user interface, functionality) relate to positive and negative feedback. This model would provide a far more detailed and nuanced understanding of user opinions, allowing you to pinpoint areas needing improvement.
The advanced method requires more initial setup, but the insights gained significantly outweigh the extra effort. The time saved in identifying key areas for improvement far surpasses the time spent setting up the more complex model. The simple method offers a quick overview, but the advanced method offers actionable insights.
Troubleshooting Common NVivo Issues
Okay, so you’re knee-deep in your research, happily coding away in NVivo, when BAM! Something goes wrong. Don’t panic! NVivo, like any powerful software, can throw some curveballs. This section covers some common issues and how to fix them. Think of it as your NVivo first-aid kit.
Troubleshooting NVivo problems often involves checking the basics first, then moving on to more advanced solutions. Remember to save your project frequently to avoid losing your work!
File Corruption and Recovery
File corruption can happen. Sometimes, NVivo might crash unexpectedly, leading to a damaged project file. NVivo’s auto-save feature can be a lifesaver, but if that fails, you might need to resort to older versions of your file if you have them saved. If you don’t have backups, unfortunately, data recovery might be challenging or even impossible. The best prevention is regular saving and using version control (if your institution provides that functionality).
Slow Performance and Freezing
NVivo can slow down, especially with large datasets. This is often due to insufficient RAM or a slow hard drive. Closing unnecessary programs, upgrading your computer’s RAM, or using a solid-state drive (SSD) can significantly improve performance. Additionally, regularly cleaning up your project (deleting unnecessary nodes, removing duplicate documents) can help optimize speed.
Import Errors
Importing data into NVivo can sometimes lead to errors. This frequently stems from incompatible file formats or issues with the data itself (e.g., corrupted files, incorrect encoding). Always check the file format compatibility before importing and try different import methods if one fails. Cleaning your data beforehand, removing special characters or inconsistencies, can also prevent import problems.
Unexpected Behavior and Bugs
Occasionally, you might encounter unexpected behavior or bugs. Updating NVivo to the latest version is the first step. If the problem persists, checking the NVivo support website or forums for known issues and solutions is recommended. Contacting NVivo support directly might be necessary for more complex or persistent problems.
Issues with Queries and Reports
Queries can sometimes yield unexpected results or errors. Double-check your query parameters, making sure the selections and filters are correctly specified. Review your coding and categorization to ensure accuracy. If errors persist, try simplifying your query or breaking it down into smaller, more manageable parts. Reviewing the NVivo help documentation on query construction is highly recommended.
| Problem | Solution |
|---|---|
| File Corruption | Use auto-save, maintain regular backups, try recovering from previous versions. |
| Slow Performance | Upgrade RAM, use an SSD, close unnecessary programs, clean up your project. |
| Import Errors | Check file format compatibility, clean your data before import, try alternative import methods. |
| Unexpected Behavior | Update NVivo, check for known issues online, contact NVivo support. |
| Query Errors | Double-check query parameters, review coding and categorization, simplify the query. |
Comparing NVivo to Alternative Software
Choosing the right qualitative data analysis software can feel overwhelming, given the variety of options available. This section compares NVivo to some popular alternatives, highlighting their strengths and weaknesses to help you make an informed decision. We’ll focus on features, capabilities, and pricing to give you a clear picture of the landscape.
Several software packages offer similar functionalities to NVivo, each with its own strengths and limitations. Direct comparisons are crucial because the best choice depends heavily on your specific research needs and budget. Factors like project size, team collaboration requirements, and the complexity of your analysis will influence your decision.
NVivo Compared to Other Qualitative Data Analysis Software
The following table summarizes key differences between NVivo and other prominent qualitative data analysis software packages. Keep in mind that software features and pricing are subject to change, so always check the vendor’s website for the most up-to-date information.
| Feature | NVivo | ATLAS.ti | MAXQDA | Dedoose |
|---|---|---|---|---|
| Core Functionality | Coding, categorization, querying, visualization, mixed methods support | Coding, categorization, network analysis, visualization | Coding, categorization, text analysis, mixed methods support | Coding, categorization, collaboration tools, cloud-based |
| Collaboration Features | Real-time collaboration (with limitations), project sharing | Limited real-time collaboration, project sharing | Project sharing, limited real-time collaboration | Robust real-time collaboration, cloud-based project management |
| Data Import/Export | Wide range of formats supported, including transcripts, audio/video | Supports various formats, including transcripts, images | Supports various formats, including transcripts, audio/video | Supports various formats, primarily through uploads to the cloud platform |
| Visualization Capabilities | Word clouds, networks, charts, matrices | Similar visualization options to NVivo | Similar visualization options to NVivo | Basic visualizations, primarily focused on data summaries |
| Pricing | Relatively expensive, tiered pricing based on features and number of users | Mid-range pricing, various license options | Mid-range pricing, various license options | Subscription-based, tiered pricing, generally more affordable than NVivo |
Rationale for Choosing NVivo
NVivo’s strength lies in its comprehensive feature set and robust capabilities for managing large and complex datasets. Researchers working with extensive qualitative data, particularly those involving mixed methods approaches, often find NVivo invaluable. Its strong visualization tools and advanced querying capabilities facilitate deeper insights. However, the cost is a significant consideration. The investment is justified for large-scale projects or institutions with significant research funding where the advanced features offer a substantial return in terms of efficiency and analytical depth.
Researchers choosing alternatives like ATLAS.ti or MAXQDA often prioritize a balance between functionality and cost. These packages provide many of NVivo’s core features at a lower price point, making them suitable for smaller projects or individual researchers with tighter budgets. Dedoose, with its cloud-based platform and strong collaboration features, is attractive for teams working on collaborative projects needing seamless real-time interaction.
Summary
So, there you have it – a comprehensive look at NVivo and its capabilities. From initial data import to final report generation, NVivo empowers researchers to uncover rich insights from qualitative data. By mastering its features, you’ll not only streamline your analysis process but also elevate the quality and impact of your research. Now go forth and analyze!
FAQ Overview
Is NVivo user-friendly for beginners?
While it has a powerful feature set, NVivo boasts a relatively intuitive interface. Many find the learning curve manageable with online tutorials and resources.
What’s the best way to organize my codes and categories?
A hierarchical structure, using broad parent categories and more specific sub-categories, is generally recommended. Consistent naming conventions are key for clarity.
Can I collaborate on a project with others using NVivo?
Yes, NVivo offers collaborative features allowing multiple users to work on the same project simultaneously, making teamwork on large projects much smoother.
What file types does NVivo support?
NVivo supports a wide variety of file types, including PDFs, Word documents, spreadsheets, audio files, and video files. The exact formats depend on the version of NVivo you’re using.
How much does NVivo cost?
NVivo’s pricing varies depending on the license type (student, individual, institutional) and the version. Check the official QSR International website for the most up-to-date pricing information.