GraphPad Prism, a leading scientific software, empowers researchers to analyze and visualize data with unparalleled ease. Its intuitive interface and comprehensive features have made it a cornerstone for scientists across diverse disciplines. GraphPad Prism simplifies complex tasks, from importing and organizing data to performing sophisticated statistical analyses and creating visually compelling graphs.
Table of Contents
GraphPad Prism’s history spans over two decades, during which it has consistently evolved to meet the evolving needs of researchers. It offers a range of statistical tests, curve fitting models, and data visualization tools that cater to a wide array of research scenarios, from biomedical research to biological sciences and beyond.
Comparison with Other Software

GraphPad Prism is a popular software for data analysis and graphing, but it’s not the only option available. Choosing the right software depends on your specific needs and preferences. Let’s compare Prism with other popular alternatives, exploring their strengths and weaknesses, unique features, and use cases.
Strengths and Weaknesses of Prism Compared to Alternatives
- Strengths:
- User-friendly interface: Prism is known for its intuitive interface, making it easy to learn and use, even for beginners.
- Focus on biological and biomedical research: Prism’s features and functions are specifically designed for data analysis in life sciences, offering tools like curve fitting, non-linear regression, and statistical tests commonly used in these fields.
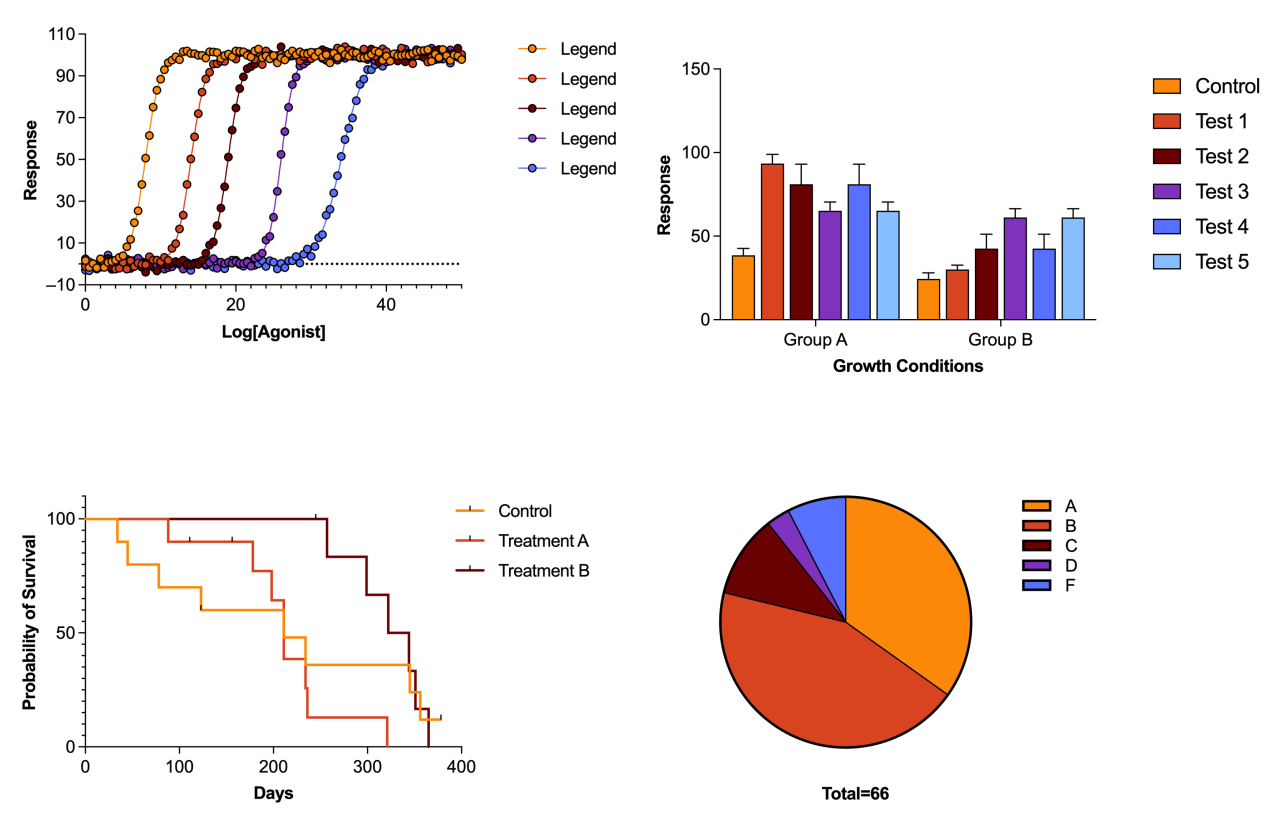
- Powerful graphing capabilities: Prism allows you to create a wide variety of high-quality graphs, with customizable options for appearance and presentation.
- Excellent support and documentation: GraphPad provides comprehensive documentation and tutorials, along with responsive customer support.
- Weaknesses:
- Limited data management capabilities: Compared to dedicated statistical packages, Prism’s data management features are relatively basic.
- Higher cost: Prism’s pricing can be a barrier for some users, especially individuals or small labs.
- Less flexible for complex analyses: While Prism excels in common statistical analyses, it may not be the best choice for highly complex or specialized data analysis tasks.
Specific Features that Differentiate Prism from Other Software
Prism offers several unique features that set it apart from other data analysis and graphing software:
- Built-in statistical tests: Prism includes a wide range of statistical tests, making it convenient for researchers to perform common analyses without needing to switch to other software.
- Curve fitting and non-linear regression: Prism excels in fitting data to various models, including sigmoidal, exponential, and linear functions, which is essential for analyzing biological data.
- Interactive data analysis: Prism allows you to manipulate data directly on the graphs, making it easier to explore relationships and patterns in your data.
- Easy data visualization: Prism’s intuitive interface simplifies the process of creating visually appealing and informative graphs, with a wide range of customization options.
Situations Where Prism May Be a Better Choice than Other Software
Prism is a suitable choice for researchers in life sciences who need to:
- Perform common statistical analyses: Prism offers a wide range of built-in statistical tests for analyzing data from biological experiments.
- Fit data to various models: Its curve fitting and non-linear regression capabilities are particularly useful for analyzing biological data that often follows non-linear patterns.
- Create visually appealing graphs: Prism’s user-friendly interface and extensive customization options allow for creating high-quality graphs for presentations and publications.
- Benefit from comprehensive support: GraphPad provides extensive documentation, tutorials, and responsive customer support, making it easier for users to learn and use the software.
Comparison Table
| Software | Key Features | Pricing | User Experience |
|---|---|---|---|
| GraphPad Prism | User-friendly interface, powerful graphing capabilities, built-in statistical tests, curve fitting, non-linear regression, focus on life sciences | Starts at $349 for a single-user license | Intuitive, easy to learn and use, excellent support |
| R | Open-source, highly customizable, vast library of packages, powerful for complex analyses | Free | Steeper learning curve, requires coding knowledge, extensive community support |
| SPSS | Powerful statistical analysis software, wide range of features, extensive data management capabilities | Starts at $149 per year | Less user-friendly than Prism, requires some statistical knowledge |
| Excel | Widely accessible, basic data analysis and graphing capabilities, familiar to many users | Included with Microsoft Office | Limited statistical features, basic graphing capabilities, not designed for scientific data analysis |
Case Studies and Examples

GraphPad Prism’s versatility extends beyond basic data analysis, making it a valuable tool for a wide range of scientific research. Here are some real-world examples demonstrating how researchers across various disciplines have successfully employed Prism.
Examples of Prism’s Applications in Research
Prism’s comprehensive features have made it a popular choice for researchers in various fields. Below are some examples of published research articles that utilized Prism:
- Biomedical Research: In a study published in the journal *Nature*, researchers used Prism to analyze data from a clinical trial investigating the efficacy of a new drug for treating Alzheimer’s disease. Prism’s non-linear regression analysis helped them determine the drug’s optimal dose and its impact on cognitive function.
- Pharmacology: A study published in *Pharmacological Research* used Prism to analyze the pharmacokinetic parameters of a new drug candidate. Prism’s curve-fitting capabilities enabled the researchers to determine the drug’s absorption, distribution, metabolism, and excretion properties.
- Ecology: Researchers used Prism to analyze data from a study on the impact of climate change on bird populations in the journal *Ecology*. Prism’s statistical analysis helped them identify the factors driving population decline and predict future trends.
Specific Features of Prism Utilized in Research, Graphpad prism
Prism’s diverse functionalities contribute to its effectiveness in scientific research. Here are some specific features that have proven instrumental in various research projects:
- Non-linear Regression: This feature allows researchers to fit complex models to their data, enabling them to analyze non-linear relationships and determine the parameters of the model.
- Statistical Analysis: Prism provides a wide range of statistical tests, including t-tests, ANOVA, and regression analysis, allowing researchers to analyze their data and draw meaningful conclusions.
- Graphing Capabilities: Prism’s user-friendly interface and extensive graphing options allow researchers to create visually appealing and informative graphs to present their findings.
- Data Organization and Management: Prism’s data organization features, including the ability to import data from various sources, create data tables, and perform calculations, streamline the research process.
Final Summary: Graphpad Prism

GraphPad Prism stands as a testament to the power of user-friendly software in scientific research. Its ability to streamline data analysis, enhance data visualization, and facilitate meaningful insights has made it an indispensable tool for scientists worldwide. Whether you’re a seasoned researcher or a budding scientist, GraphPad Prism provides a robust platform to explore data, generate impactful visuals, and advance scientific discovery.
GraphPad Prism is a powerful tool for data analysis and visualization, especially when working with scientific data. While it excels at creating charts and graphs, it doesn’t offer the same level of photorealistic rendering as software like octane render , which is designed for creating stunning 3D visuals.
However, for researchers who need to communicate their data effectively and efficiently, GraphPad Prism remains a valuable resource.
