XLSTAT, a powerful statistical analysis add-in for Microsoft Excel, empowers users to unlock valuable insights from their data. Developed by Addinsoft, XLSTAT has become a go-to solution for professionals across diverse fields, including healthcare, finance, and marketing, providing them with advanced statistical tools and capabilities directly within the familiar Excel environment.
Table of Contents
XLSTAT’s comprehensive features encompass a wide range of statistical techniques, from basic descriptive statistics and hypothesis testing to advanced machine learning algorithms. This versatile tool caters to both novice and experienced users, offering a user-friendly interface and a comprehensive suite of features that streamline data analysis workflows.
XLSTAT Features
XLSTAT is a powerful statistical software add-in for Microsoft Excel that provides a comprehensive suite of tools for data analysis, statistical modeling, and data visualization. With its user-friendly interface and wide range of features, XLSTAT empowers users of all skill levels to gain valuable insights from their data.
Basic Statistics
XLSTAT offers a wide range of basic statistical tools that are essential for data analysis and understanding. These tools include descriptive statistics, hypothesis testing, correlation analysis, and more.
The benefits of using XLSTAT for basic statistics include:
* Easy-to-use interface: XLSTAT’s intuitive interface makes it easy to perform basic statistical analysis, even for users with limited statistical knowledge.
* Comprehensive analysis: XLSTAT provides a wide range of statistical tests and measures, allowing for a thorough analysis of data.
* Integration with Excel: XLSTAT seamlessly integrates with Microsoft Excel, making it easy to import, analyze, and visualize data.
Regression Analysis
Regression analysis is a powerful technique used to model the relationship between a dependent variable and one or more independent variables. XLSTAT offers a variety of regression models, including linear regression, multiple regression, logistic regression, and more.
The benefits of using XLSTAT for regression analysis include:
* Model selection: XLSTAT provides tools for model selection, helping users choose the best model for their data.
* Model diagnostics: XLSTAT offers comprehensive model diagnostics, allowing users to assess the quality of their models.
* Prediction: XLSTAT can be used to predict the value of the dependent variable based on the values of the independent variables.
ANOVA
Analysis of variance (ANOVA) is a statistical technique used to compare the means of two or more groups. XLSTAT offers a variety of ANOVA tests, including one-way ANOVA, two-way ANOVA, and repeated measures ANOVA.
The benefits of using XLSTAT for ANOVA include:
* Data comparison: ANOVA allows users to compare the means of different groups and determine if there are statistically significant differences.
* Factor analysis: ANOVA can be used to analyze the effects of multiple factors on a dependent variable.
* Post-hoc analysis: XLSTAT provides post-hoc tests to further investigate significant differences between groups.
Data Visualization, Xlstat
Data visualization is a crucial aspect of data analysis, as it allows users to visually represent and explore data. XLSTAT offers a variety of data visualization tools, including charts, graphs, and maps.
The benefits of using XLSTAT for data visualization include:
* Interactive visualizations: XLSTAT’s visualizations are interactive, allowing users to explore data and gain insights.
* Customizable charts: XLSTAT provides a wide range of chart types and customization options, allowing users to create visualizations that meet their specific needs.
* Export options: XLSTAT allows users to export visualizations in various formats, making it easy to share results with others.
Advanced Statistical Techniques
XLSTAT offers a wide range of advanced statistical techniques, including:
* Multivariate analysis: XLSTAT provides tools for multivariate analysis, such as principal component analysis (PCA), cluster analysis, and discriminant analysis.
* Time series analysis: XLSTAT offers tools for time series analysis, such as forecasting, smoothing, and trend analysis.
* Quality control: XLSTAT provides tools for quality control, such as control charts and process capability analysis.
XLSTAT Modules
| Module | Capabilities | Use Cases |
|—|—|—|
| Basic Statistics | Descriptive statistics, hypothesis testing, correlation analysis | Understanding data distributions, comparing groups, identifying relationships between variables |
| Regression Analysis | Linear regression, multiple regression, logistic regression | Predicting outcomes, identifying key drivers of a dependent variable, understanding relationships between variables |
| ANOVA | One-way ANOVA, two-way ANOVA, repeated measures ANOVA | Comparing means of different groups, analyzing the effects of multiple factors on a dependent variable |
| Data Visualization | Charts, graphs, maps | Visualizing data patterns, exploring relationships between variables, presenting results |
| Multivariate Analysis | Principal component analysis (PCA), cluster analysis, discriminant analysis | Reducing dimensionality, identifying groups of similar observations, classifying observations |
| Time Series Analysis | Forecasting, smoothing, trend analysis | Predicting future values, understanding patterns in time series data |
| Quality Control | Control charts, process capability analysis | Monitoring process performance, identifying and addressing quality issues |
XLSTAT User Interface and Learning Curve

XLSTAT offers a user-friendly interface that is intuitive and easy to navigate. The software seamlessly integrates with Microsoft Excel, making it accessible to users familiar with spreadsheets. This integration allows for easy data import, analysis, and visualization, minimizing the learning curve for Excel users.
User Interface
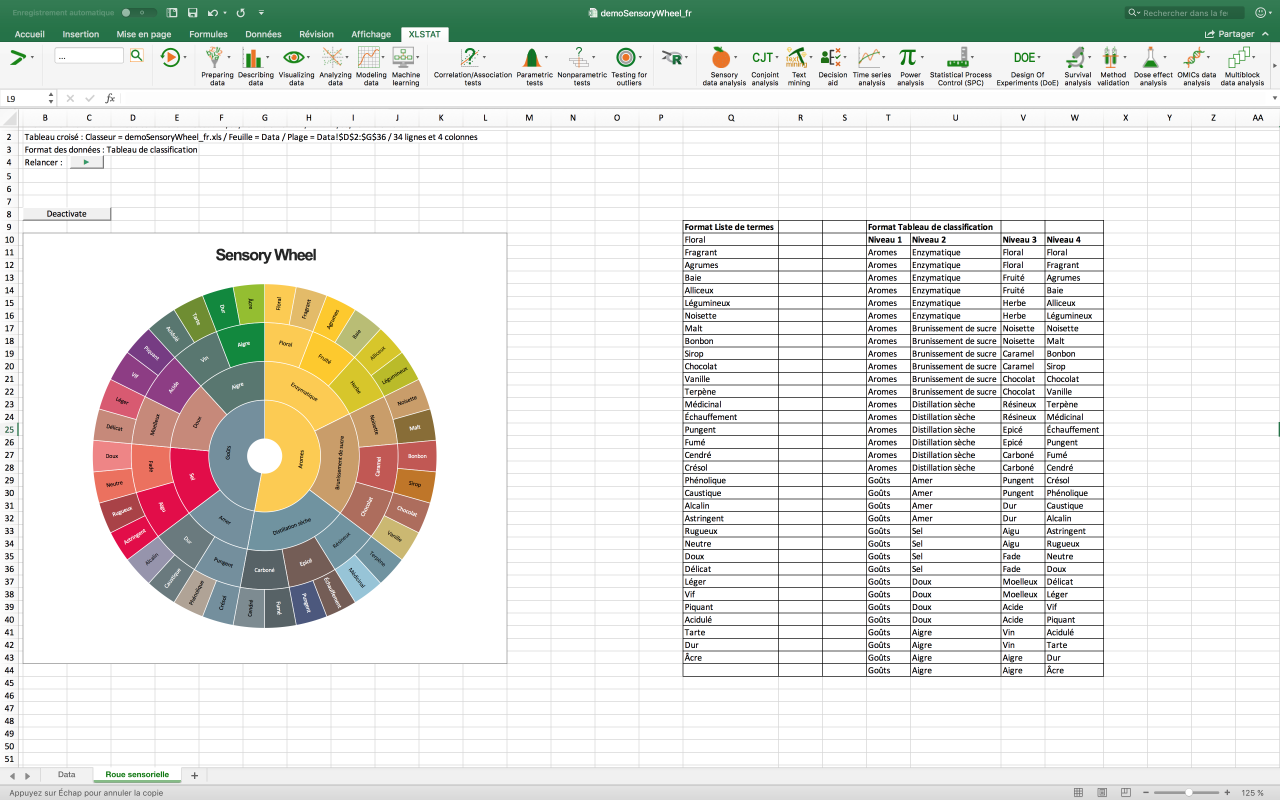
The XLSTAT interface is designed to be intuitive and user-friendly, with a clear layout and easy-to-understand menus. Users can easily access various statistical tools and features through the ribbon-like interface, similar to other Microsoft Office applications. This familiar design makes it easy for users to navigate and find the tools they need.
Learning Curve
The learning curve for XLSTAT is relatively gentle, especially for users familiar with Microsoft Excel. The software’s integration with Excel allows for a smooth transition, with most functionalities readily accessible through familiar Excel menus. XLSTAT’s comprehensive documentation and tutorials further simplify the learning process.
Resources and Tutorials
XLSTAT provides a wealth of resources to help users learn the software effectively. These resources include:
- User Manual: A comprehensive guide that covers all aspects of XLSTAT, including installation, data analysis, and visualization.
- Tutorials: Step-by-step guides that demonstrate how to perform specific statistical analyses using XLSTAT.
- Online Help: A searchable database of information about XLSTAT’s features and functionalities.
- Webinars and Workshops: XLSTAT offers regular webinars and workshops that provide in-depth training on various statistical topics and techniques.
Closure

With its seamless integration with Excel, user-friendly interface, and powerful statistical capabilities, XLSTAT provides a comprehensive solution for data analysis needs. Whether you’re a researcher seeking to validate hypotheses, a business analyst aiming to identify trends, or a marketer seeking to optimize campaigns, XLSTAT equips you with the tools to extract meaningful insights from your data, driving informed decision-making and achieving impactful results.
XLSTAT is a powerful statistical analysis software that can be used for a wide range of tasks, from basic descriptive statistics to complex multivariate analysis. While XLSTAT excels at data analysis, it’s not designed for document management. If you need to combine multiple PDF files, you might want to consider using a tool like adobe merge pdf.
This online tool allows you to easily merge multiple PDF documents into a single file, saving you time and effort. Once your PDFs are combined, you can then analyze the data within them using XLSTAT.
